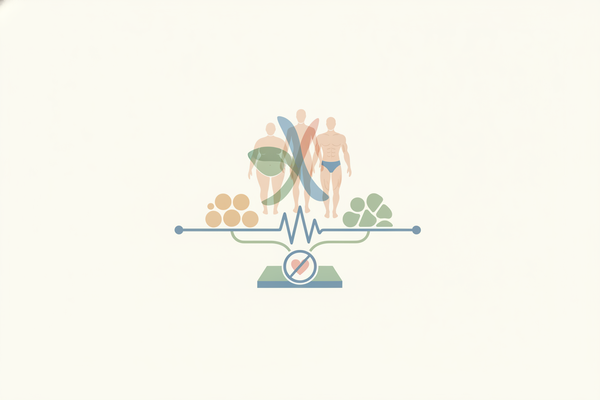
Healthy Weight Indicators for Older Adults: Beyond BMI Explained
Discover healthy weight indicators for older adults including BMI, body fat, waist measures, and muscle mass for a complete health picture.


Estimated reading time: 18 min
Key Takeaways
- Healthy weight indicators for older adults extend beyond BMI to include body fat percentage, waist circumference, and muscle mass, providing a more holistic view of health.
- BMI ranges may differ for seniors; a slightly higher BMI (up to about 27) is sometimes associated with healthier aging due to changes in body composition and potential protective effects, though individual factors vary.
- Waist-to-height ratio and waist circumference are useful measures to assess excess abdominal fat, which is linked to metabolic and cardiovascular risks.
- Monitoring muscle strength, mobility, and unintentional weight loss is important for early detection of frailty and sarcopenia, conditions that can affect quality of life in older adults.
- Consulting healthcare professionals for personalized assessment ensures safe, effective management of weight and overall health in older adults, particularly when managing chronic conditions or medications.
Table of Contents
- Section 1: Understanding BMI and Its Limitations in Older Adults
- Section 2: The Role of Body Fat Percentage and Why It Matters
- Section 3: Waist Circumference and Waist-to-Height Ratio as Key Health Markers
- Section 4: Identifying Underweight, Frailty, and Muscle Loss in Seniors
- Section 5: Chronic Conditions and Medications Impact on Healthy Weight
- Section 6: Muscle Mass, Strength, Mobility and Their Importance Beyond the Scale
- Conclusion
- FAQ
Section 1: Understanding BMI and Its Limitations in Older Adults
What Does BMI Really Mean?
Body Mass Index (BMI) is a widely used tool that calculates a number based on an individual's weight in kilograms divided by the square of their height in meters (kg/m2). The resulting number categorizes people as underweight, normal weight, overweight, or obese according to established ranges. For the general adult population, a BMI between 18.5 and 24.9 is traditionally considered healthy.
However, BMI is a rough guideline that doesn't directly measure body fat or muscle mass. It also doesn’t account for how fat is distributed throughout the body. For this reason, BMI has limitations, especially in older adults, whose bodies undergo changes that affect what a "healthy" BMI looks like.
Why BMI Ranges Differ for Older Adults
As people age, their body composition changes. Muscle mass naturally declines—a process called sarcopenia—while fat mass tends to increase or redistribute, often accumulating around the abdomen. These shifts may occur even if overall weight remains stable. Additionally, height tends to decrease slightly with age due to spinal compression and postural changes, which can artificially raise BMI when calculated.
Because of these factors, a BMI that is considered "normal" for younger adults might not fully reflect health status in seniors. Some studies suggest that older adults with a BMI in the range of approximately 25 to 27 may have better survival rates and less frailty compared to those with lower BMIs. This observation is sometimes referred to as the "obesity paradox" in aging, though it is not universally accepted and individual health status varies.
It’s important to emphasize that this doesn’t mean all higher BMIs are healthy; the context of body composition and functional status matters greatly. For a more comprehensive understanding, see our guide on How to Tell If You Are at a Healthy Weight: The Complete Guide.
BMI Limitations and Skinny Fat Phenomenon
The term "skinny fat" describes individuals who have a normal or low BMI but a high body fat percentage, particularly visceral fat around internal organs. This hidden fat may increase risks for cardiovascular disease, type 2 diabetes, and metabolic syndrome.
In older adults, this condition is common because muscle loss lowers weight and BMI, masking unhealthy fat accumulation. For example, a 70-year-old woman might have a BMI of 23, yet have a body fat percentage over 35%, placing her at increased health risk despite a "normal" BMI.
Since BMI doesn’t differentiate between fat and muscle, it’s insufficient alone to assess healthy weight or metabolic risk in seniors.
To learn more about BMI's limitations, the blog post BMI Limitations: What BMI Really Means (and Misses) for Your Health offers a detailed exploration.
Section 2: The Role of Body Fat Percentage and Why It Matters
Body Fat Percentage Explained
Body fat percentage measures the portion of your total weight that comes from fat tissue, as opposed to lean mass (muscle, bones, organs, water). This metric provides a clearer picture of body composition than BMI because it directly quantifies fat, which is metabolically active and linked to disease risk.
For older adults, body fat percentage is particularly important because excess fat—especially visceral fat around the abdomen—can exacerbate age-related health issues such as insulin resistance, inflammation, and cardiovascular disease. Conversely, too low body fat can impair hormonal balance and energy reserves.
How to Measure Body Fat Percentage
There are several methods to estimate body fat percentage, each varying in accuracy, cost, and accessibility:
- Skinfold Calipers: Measure subcutaneous fat at specific body sites. They are inexpensive and portable but require proper technique and may underestimate visceral fat.
- Bioelectrical Impedance Analysis (BIA): Devices send a small electrical current through the body to estimate fat based on resistance. Home scales often use this method, which is convenient but influenced by hydration status and other factors.
- Dual-Energy X-ray Absorptiometry (DEXA): Clinically considered a gold standard, DEXA scans provide precise measurements of fat, muscle, and bone mass. They require specialized equipment and are more costly but very reliable.
- Air Displacement Plethysmography (Bod Pod) and Hydrostatic Weighing: Other accurate methods typically found in research or clinical settings.
Regularly tracking body fat percentage over time helps distinguish whether weight changes stem from fat or muscle loss—important for designing safe weight management plans in seniors.
Interpreting Body Fat in Older Adults
Healthy body fat percentage ranges vary by age and sex. For example, typical healthy ranges might be:
- Women aged 60+: approximately 25–35%
- Men aged 60+: approximately 18–28%
Older adults naturally carry slightly higher fat percentages than younger adults, partly due to hormonal changes and metabolic shifts. However, exceeding these ranges may increase risk for metabolic and cardiovascular diseases.
Importantly, body fat percentage should not be interpreted in isolation. Combining it with waist circumference, muscle strength, and mobility assessments provides a more complete understanding of health status.
Section 3: Waist Circumference and Waist-to-Height Ratio as Key Health Markers
Why Waist Measures Matter
Waist circumference directly measures abdominal fat, particularly visceral fat, which is more metabolically active and harmful than fat stored elsewhere. Excess abdominal fat is linked to insulin resistance, hypertension, dyslipidemia, and increased risk of heart disease and stroke.
In older adults, waist circumference often predicts health risks better than BMI because it reflects fat distribution changes that occur with aging. For instance, an older adult with a normal BMI but increased waist size may face higher cardiometabolic risk.
Healthy Waist Circumference Thresholds
- For men, a waist circumference below 102 cm (40 inches) is generally considered low risk.
- For women, a waist circumference below 88 cm (35 inches) is the typical healthy cutoff.
It’s important to note these thresholds may differ based on ethnicity and individual health profiles. For example, people of Asian descent may have increased risk at lower waist measurements.
Waist-to-Height Ratio: A Practical Tool
The waist-to-height ratio (WHtR) is calculated by dividing waist circumference by height—both measured in the same units (e.g., centimeters). A WHtR below 0.5 is widely recommended as a healthy target to minimize risk of cardiometabolic diseases.
This ratio is particularly useful in older adults because it adjusts for height changes that occur with age due to spinal compression or posture. For example, an older adult who has lost height but maintained waist size may have a higher WHtR, signaling increased health risk despite a stable BMI.
In practice, measuring waist circumference and comparing it to height is an easy, cost-effective way to identify risk. For example, a 160 cm tall woman should aim to keep her waist circumference below 80 cm to maintain a WHtR under 0.5.
Understanding your waist-to-height ratio can help answer the question, "Am I overweight?" more precisely than BMI alone, especially in the context of aging.
Section 4: Identifying Underweight, Frailty, and Muscle Loss in Seniors
Warning Signs of Being Underweight or Frail
While excess weight is often emphasized, being underweight or experiencing unintentional weight loss in older adults is also concerning. It may indicate malnutrition, chronic illness, or the onset of frailty.
Frailty is a syndrome characterized by decreased physiological reserves and increased vulnerability to stressors. Early signs include:
- Weight loss greater than 5% over 6-12 months without intentional dieting or exercise changes.
- Muscle weakness, often noticed as difficulty carrying groceries or rising from a chair.
- Reduced appetite or swallowing difficulties, which can lead to inadequate nutrient intake.
- Fatigue and decreased physical activity levels.
- Slow walking speed or impaired balance.
Recognizing these signs promptly is important because frailty is linked to higher risks of falls, hospitalization, disability, and mortality.
Sarcopenia: Hidden Muscle Loss
Sarcopenia refers specifically to the progressive loss of skeletal muscle mass and strength with aging. It can coexist with normal or high fat mass, a condition sometimes called sarcopenic obesity.
This muscle loss affects functional abilities such as climbing stairs, carrying objects, and maintaining balance, increasing the risk of falls and fractures. Sarcopenia also impairs metabolism, potentially contributing to insulin resistance and glucose intolerance.
Regular strength assessments can help detect sarcopenia early:
- Handgrip strength: A simple, validated test; low grip strength is a marker of sarcopenia.
- Chair stand test: Measures lower body strength by timing how quickly an individual can stand from a seated position multiple times.
- Gait speed: Slow walking speed correlates with muscle weakness and frailty.
Combining these functional tests with body composition assessments provides a comprehensive picture of muscle health.
When to Seek Professional Help
If an older adult or caregiver notices unexplained weight loss, decreased strength, or mobility difficulties, it’s important to consult a healthcare provider or registered dietitian promptly. They can perform thorough evaluations including:
- Detailed medical history and physical examination.
- Muscle mass measurement via DEXA or BIA.
- Nutritional assessments to identify deficiencies or malabsorption.
- Review of medications that may affect appetite or metabolism.
Based on findings, personalized interventions such as nutritional supplementation, tailored exercise programs, or medication adjustments can be implemented to improve outcomes and quality of life.
Section 5: Chronic Conditions and Medications Impact on Healthy Weight
How Chronic Illness Affects Weight
Chronic health conditions common in older adults often affect body weight and composition. For example:
- Diabetes: May cause weight loss if poorly controlled, or weight gain due to insulin therapy or lifestyle factors.
- Heart disease: Fluid retention from heart failure can cause rapid weight gain unrelated to fat mass.
- Arthritis: Joint pain may limit mobility, reducing physical activity and leading to muscle loss or weight gain.
- Thyroid disorders: Hypothyroidism can cause weight gain, while hyperthyroidism often leads to weight loss.
These complex interactions mean that weight changes in seniors should be interpreted within the context of overall health and medical conditions.
Medications and Weight Changes
Many medications commonly prescribed to older adults impact appetite, metabolism, or fluid balance, contributing to weight fluctuations. Examples include:
- Corticosteroids: Often cause increased appetite and fat redistribution, leading to weight gain.
- Diabetes medications: Some, like GLP-1 receptor agonists (e.g., Ozempic, Wegovy), are associated with weight loss, while others may cause weight gain. For detailed information on these medications, see our GLP-1 Weight Loss: The Definitive Guide to Medications, Results, and Safety.
- Antidepressants and antipsychotics: Can influence appetite and metabolism variably.
- Diuretics: Influence fluid balance and may cause weight loss via fluid depletion.
- Chemotherapy agents: May cause nausea, loss of appetite, and weight loss.
Tracking weight changes alongside medication regimens helps distinguish side effects from disease progression or other factors.
Importance of Coordinated Care
Given these complexities, it’s essential for older adults to work closely with their healthcare team to manage weight effectively. This includes:
- Regular monitoring of weight, body composition, and functional status.
- Medication reviews to evaluate side effects impacting weight or appetite.
- Nutrition counseling tailored to medical conditions and preferences.
- Incorporation of physical activity and rehabilitation to maintain muscle mass and mobility.
Using comprehensive tracking tools like Trimm can support this coordinated approach by helping patients and providers monitor doses, weight trends, side effects, and overall progress during weight management journeys, including those involving GLP-1 medications.
Section 6: Muscle Mass, Strength, Mobility and Their Importance Beyond the Scale
Why Muscle Matters More Than the Number on the Scale
Muscle mass is a critical determinant of health and independence in older adults. Beyond contributing to strength and mobility, muscle plays a vital role in metabolic regulation, including glucose metabolism and insulin sensitivity. Losing muscle can lead to frailty, increased fall risk, and decreased quality of life.
Focusing solely on weight or BMI ignores the significance of body composition. For example, two older adults with the same BMI might have vastly different health profiles if one has preserved muscle mass and the other has significant muscle loss with higher fat.
For more on understanding healthy weight beyond BMI, see Is My Weight Healthy? Understanding BMI, Body Fat, and More.
Assessing Strength and Mobility
Practical assessments to evaluate muscle function include:
- Grip Strength Test: Using a dynamometer, grip strength correlates with overall muscle strength and predicts outcomes such as disability and mortality.
- Timed Up and Go Test: Measures the time taken to stand from a chair, walk three meters, turn, walk back and sit down; assesses mobility and balance.
- Chair Stand Test: Measures lower body strength by timing how quickly an individual can rise from a chair multiple times.
- Balance Assessments: Tests like the tandem stand or one-leg stand identify fall risk.
These tests are simple, quick, and can be administered in clinics or at home with guidance.
Promoting Muscle Health
Preserving or rebuilding muscle mass requires a multifaceted approach:
- Resistance and Strength Training: Engaging in exercises such as weight lifting, resistance band workouts, or bodyweight exercises at least 2–3 times per week helps stimulate muscle growth and strength.
- Protein Intake: Older adults often need higher protein intake (around 1.0–1.2 grams per kilogram of body weight daily) to maintain muscle. Sources include lean meats, dairy, legumes, and plant-based proteins.
- Vitamin D and Other Nutrients: Adequate vitamin D, calcium, and other micronutrients support muscle and bone health.
- Managing Chronic Conditions: Controlling diseases like diabetes and arthritis reduces inflammation and supports activity.
- Physical Activity: Incorporating daily movement, balance exercises, and aerobic activity supports cardiovascular health and functional ability.
Older adults should collaborate with healthcare providers, physical therapists, or dietitians to develop tailored exercise and nutrition plans that consider their abilities, preferences, and medical conditions.
Conclusion
Understanding healthy weight indicators for older adults requires a comprehensive approach that moves beyond BMI. Body fat percentage, waist circumference, waist-to-height ratio, muscle mass, and functional assessments provide a richer picture of health and risk factors.
Aging introduces unique challenges such as sarcopenia, frailty, and medication effects that complicate traditional weight metrics. Therefore, personalized assessments and coordinated care with clinicians or dietitians are essential to support safe and effective weight and health management.
For those on weight management journeys, particularly when using GLP-1 medications like Ozempic or Wegovy, tools like Trimm can facilitate comprehensive tracking of doses, weight changes, side effects, and progress in one accessible platform, empowering safer and more informed decisions.
FAQ
Q: What is a healthy BMI for older adults?
A: While the standard adult BMI range is 18.5 to 24.9, some experts consider a slightly higher BMI, up to about 27, as potentially healthy for adults aged 65 and older. This reflects age-related changes in body composition and may offer protective effects against frailty and unintentional weight loss in some individuals. However, BMI should be interpreted alongside other health indicators and individual circumstances.
Q: Is a BMI of 25 to 27 healthy for seniors?
A: A BMI between 25 and 27 can be healthy for some older adults and has been associated in some studies with better survival and lower frailty risk compared to lower BMIs. It’s important to consider muscle mass, fat distribution, and functional status along with BMI to get a full health picture.
Q: What waist size is considered healthy for older adults?
A: Generally, waist circumference below 102 cm (40 inches) for men and below 88 cm (35 inches) for women is considered low risk. Additionally, maintaining a waist-to-height ratio below 0.5 is a useful target that accounts for height differences, especially relevant in older adults. Individual risk may vary based on ethnicity and health status.
Q: Why is BMI less accurate in older adults?
A: BMI doesn’t account for age-related loss of muscle mass or changes in fat distribution. Older adults may have a normal BMI but elevated body fat percentage and sarcopenia, making BMI an incomplete measure of health risk in this population.
Q: What are signs that an older adult is underweight or frail?
A: Warning signs include unintentional weight loss greater than 5% in 6-12 months, muscle weakness, fatigue, reduced appetite, slowed walking speed, and decreased mobility. These signs should prompt medical evaluation for underlying causes and intervention.
Q: Should older adults worry more about weight or muscle mass?
A: Maintaining muscle mass and strength is often more important than focusing solely on weight, as muscle supports mobility, balance, metabolic health, and independence. A holistic approach that includes muscle preservation alongside healthy weight management is recommended.