
Analyzing Weight Loss Data Trends in GLP-1 Therapy
Explore the impact of GLP-1 therapy by analyzing weight loss data trends. Discover true effectiveness, patient variability, and guide better obesity care.

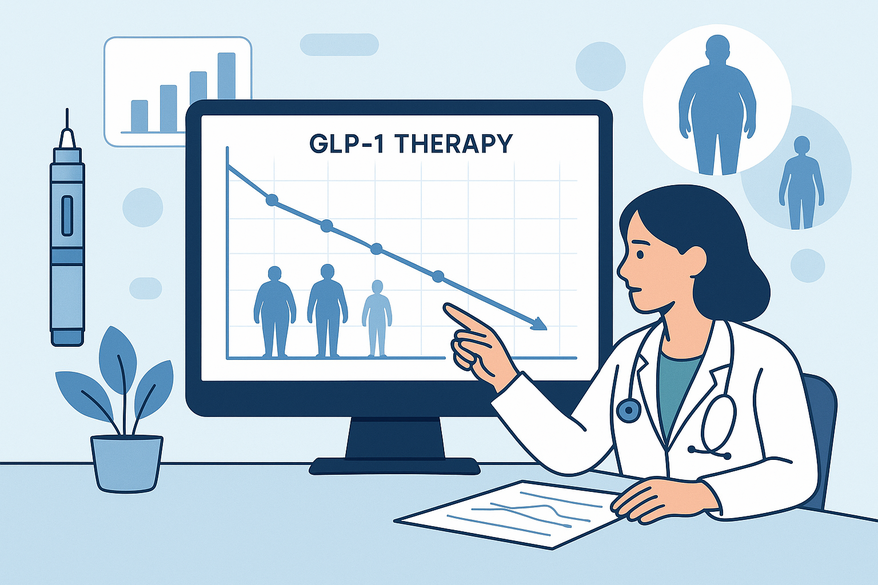
Estimated reading time: 10 minutes
Key Takeaways
- Data-driven insights reveal real-world effectiveness and guide better obesity care.
- GLP-1 therapy can induce 15–25% weight loss in one year but outcomes vary by subgroup.
- Key metrics include percent weight loss thresholds, treatment persistence, and metabolic labs.
- Robust methods (regression, propensity scores, survival analysis) ensure accurate trend interpretation.
- Future directions involve novel incretin agonists, digital health integration, and equity analyses.
Table of Contents
- I. Introduction
- II. Background on GLP-1 Therapy
- III. Importance of Analyzing Weight Loss Data Trends
- IV. Key Metrics and Observed Trends
- V. Methodologies for Analysis
- VI. Case Studies & Real-World Applications
- VII. Implications & Future Directions
- VIII. Conclusion
- IX. Additional Resources
- FAQ
I. Introduction
Analyzing weight loss data trends is the central focus of this guide. We explore how numbers reveal the real impact of modern obesity treatments, especially GLP-1 therapy.
Why data-driven insights matter:
- They show true effectiveness beyond trials.
- They uncover who gains most and when results fade.
- They guide better care and policy.
What is GLP-1 therapy? GLP-1 therapy mimics glucagon-like peptide-1, a hormone that controls hunger and blood sugar. It can cut body weight by about 15–25% over one year in many patients (NCBI PMC article). Real-world use of GLP-1 drugs has grown fast, with variable outcomes across groups (BCBS Issue Brief).
In this guide, we will:
- Define GLP-1 therapy and its rise.
- Show why analyzing weight loss data trends is vital.
- Review key metrics, methods, and real-world examples.
Early, clear data analysis sparks smarter obesity care.
For individuals on a GLP-1 journey, tracking all relevant metrics in one place streamlines data-driven insights — a capability offered by Trimm, which turns your doses, weight, side effects, and more into clear charts and milestones.
II. Background on GLP-1 Therapy
A. Definition & Clinical Context (GLP-1 therapy)
GLP-1 receptor agonists (GLP-1 RAs) copy the gut hormone GLP-1. They were first developed to treat type 2 diabetes by:
- Boosting insulin release.
- Lowering glucagon (the hormone that raises blood sugar).
- Slowing stomach emptying.
- Making people feel full.
Approved agents include:
- Semaglutide (Wegovy/Ozempic) for chronic weight management.
- Liraglutide (Saxenda) for obesity.
- Exenatide, Dulaglutide, and others in diabetes.
Prescription patterns are shifting toward higher-dose semaglutide for weight loss (AJMC prescribing trends).
B. Mechanism of Action (GLP-1 therapy)
GLP-1 RAs help with weight loss by three main pathways:
- Central appetite regulation: They act on the brain’s hunger centers to cut cravings and food intake (NCBI PMC article).
- Slowed gastric emptying: Food stays in the stomach longer, boosting fullness and lowering calories eaten (NCBI PMC article).
- Metabolic effects: They improve insulin secretion and reduce glucagon, helping manage blood sugar and indirectly supporting weight loss (UChicago Medicine research).
C. Research Focus: Uptake and Spending (GLP-1 therapy)
- Prescriptions for GLP-1s in obesity rose about six-fold from 2019 to 2024 (Healthcare Dive analysis).
- U.S. spending on GLP-1 drugs jumped over 500% between 2018 and 2023 (AMA spending report).
III. Importance of Analyzing Weight Loss Data Trends
A. Why Trend Analysis Matters
- Distinguishes real-world effectiveness from trial efficacy (NCBI PMC article).
- Reveals variation in patient outcomes, high costs, and early dropouts (BCBS Issue Brief).
- Helps balance benefits (weight loss) against risks (side effects, lean mass loss) (NCBI PMC article).
B. Benefits of a Data-Driven Approach
- Quantify average weight loss at 12, 26, and 52 weeks (NCBI PMC article).
- Link treatment persistence to outcomes (BCBS Issue Brief).
- Assess patient-level variability: age, BMI, comorbidities, socioeconomic status (CDC data brief).
C. Challenges in Data Collection
- Heterogeneous endpoints: % loss, kg lost, BMI change vary by study (NCBI PMC article).
- Inconsistent follow-up: Dropout bias and missing data (BCBS Issue Brief).
- Confounding factors: Lifestyle counseling, other drugs, selection bias (Healthcare Dive analysis).
IV. Analyzing weight loss data trends: Key Metrics and Observed Trends
A. Core Metrics
- Weight and BMI: Baseline vs. follow-up at 3, 6, 12 months (see our tracking guide).
- Percent weight loss thresholds: ≥5%, ≥10%, ≥15% (EpiC research tracker).
- Metabolic labs: HbA1c, lipids, blood pressure, waist size (UChicago Medicine research).
- Adherence: Weeks on therapy, discontinuation rates (BCBS Issue Brief).
- Safety and body composition: GI side effects, lean mass changes (see side-effect management guide).
B. Observed Trends
- Average weight loss: 15–25% at 1 year; up to 22.5% at 72 weeks with dual agonists (NCBI PMC article).
- PCOS cohort: Median 11.5% vs. 1.9% weight loss without GLP-1 (EpiC research tracker).
- Weight regain: High rates of regain after stopping treatment (NCBI PMC article).
- Persistence link: Only ~50% stay on therapy 12+ weeks, the point at which weight loss becomes meaningful (BCBS Issue Brief).
C. Statistical Methods & Tools
- Descriptive stats: Means, medians, SD, IQR.
- Regression models: Linear, logistic, Cox-proportional hazards, mixed effects.
- Propensity scores: Adjust for confounding in observational data.
- Software: R, Python (pandas, SciPy), SAS, Stata, SQL.
V. Methodologies for Analyzing weight loss data trends
A. Data Analysis Workflow
- Data gathering: trials, EHRs, claims, registries, patient surveys.
- Data cleaning: fix missing values, outliers, standardize units.
- Analysis: compute averages, apply models to find predictors.
- Interpretation: translate results into clinical insights (e.g., % difference vs. control).
B. Specific Analytical Techniques
- Trend analysis: Time-series of prescriptions and weight outcomes (learn more: mastering trend analysis).
- Regression: Identify baseline factors tied to weight loss or persistence (BCBS Issue Brief).
- Survival/Cox models: Time to discontinuation and its impact on outcomes (BCBS Issue Brief).
- Responder analyses: Categorize patients by ≥5/10/15% loss (NCBI PMC article).
C. Visualizations
- Line graphs: Weight trajectories by drug or subgroup.
- Bar charts: % of patients hitting weight-loss goals.
- Kaplan–Meier curves: Treatment persistence over time.
- Scatter plots: Baseline BMI vs. % weight loss (BCBS Issue Brief).
VI. Case Studies & Real-World Applications in GLP-1 therapy
A. Blue Cross Blue Shield Claims Study
Early discontinuation before 12 weeks was common. ~50% persistence at 12 weeks linked to meaningful weight loss (BCBS Issue Brief).
B. PCOS Cohort Analysis
Patients with PCOS lost a median 11.5% weight vs. 1.9% without GLP-1, showing benefit in specific subgroups (EpiC research tracker).
C. Clinical Trial Meta-Analysis
Average 15–25% weight reduction at ~1 year; up to 22.5% with dual agonists at 72 weeks—and a high rate of regain after stopping (NCBI PMC article). For a deeper dive into the clinical evidence and patient experiences, see real results from GLP-1 therapy. For a comprehensive overview of medications, expected results, and safety considerations, see our definitive guide to GLP-1 weight loss.
D. Clinical Implications
- Adherence support: Regular follow-up improves persistence (BCBS Issue Brief).
- Patient selection: Use predictors of response to set realistic goals (NCBI PMC article).
- Chronic care model: Obesity needs long-term maintenance and lifestyle support (NCBI PMC article).
VII. Implications & Future Directions for Analyzing weight loss data trends
A. Advancing Weight Management Strategies
- Refine treatment algorithms by matching patients to the right agent and dose (NCBI PMC article).
- Inform payer coverage and cost-effectiveness based on real-world data (AMA spending report).
- Integrate lifestyle and behavioral support with pharmacotherapy.
B. Emerging Trends
- New dual/triple incretin agonists promise greater weight loss (NCBI PMC article).
- Long-term registry studies to track outcomes over many years.
- Digital health tools (wearables, remote monitoring) for richer data, as explored in GLP-1 integration with wearables.
- Equity analyses to address access and outcome disparities (CDC data brief).
C. Role of Ongoing Analysis
- Shape guideline updates on when and how to start or stop therapy.
- Enable adaptive protocols based on early response patterns.
- Guide combination therapies and maintenance strategies.
VIII. Conclusion: Analyzing weight loss data trends
Analyzing weight loss data trends is vital to see how GLP-1 therapy works outside trials. It helps us:
- Measure true benefits and risks.
- Pinpoint key metrics: % weight loss, persistence, regain.
- Use robust methods for clear insights.
Call to action: Clinicians, researchers, and policymakers should leverage data-driven methods in research, care, and policy to optimize obesity treatment for all.
IX. Additional Resources for Analyzing weight loss data trends
- Clinical review on GLP-1 mechanisms and efficacy
- UChicago Medicine research
- BCBS Issue Brief on utilization trends
- CDC data brief
- Healthcare Dive analysis
- AMA spending report
- Analytical tool tutorials for R and Python (survival, regression)
- Key topics: weight regain, comparative effectiveness, economics of GLP-1 therapy
FAQ
What metrics should I track when analyzing GLP-1 weight loss data?
Focus on percent weight loss thresholds (≥5%, ≥10%, ≥15%), changes in BMI, metabolic labs (HbA1c, lipids, blood pressure), and adherence measures such as weeks on therapy and discontinuation rates.
How does treatment persistence influence outcomes?
Persistence beyond 12 weeks is critical: patients who stay on GLP-1 therapy for 12+ weeks tend to achieve meaningful weight loss, while early dropouts often show minimal results.
Which statistical methods are most common?
Descriptive statistics, regression models (linear, logistic, Cox), and propensity‐score adjustments are widely used. Survival analysis (Kaplan–Meier, Cox-proportional hazards) helps assess treatment persistence.
How do missing data and dropouts affect trend analysis?
Missing follow-ups can introduce bias, overstating or understating real-world effectiveness. Robust cleaning, imputation techniques, and sensitivity analyses are essential to mitigate this.
What future directions are emerging in GLP-1 weight loss research?
Look for studies on dual/triple incretin agonists, long-term registry data, digital health integration (wearables, remote monitoring), and equity analyses to ensure fair access and outcomes.